
Start with the problem period, then check the adjacent larger scale to avoid mistaking a local jump for a long-term trend.
A practical approach
All master records are created manually and remain on the device. There is no account or cloud synchronization, so the user controls export, backup and deletion.
Different windows answer different questions: the short one shows details, the long one shows the general picture and changing modes. First practical guide for this task: open 7 days to check recent entries.
Four consecutive steps
- 01
Open 7 days to check recent entries.
- 02
Go to month or 3 months for trend.
- 03
Use year to find larger periods.
- 04
Open specific dates via a calendar for context.
What most often distorts observation?
- Compare the slope of graphs with different scales visually.
- Ignore the number of points.
- Consider the line a forecast of the future.
How does this relate to Vesometr
Vesometr offers five fixed ranges without server processing or forecasting.
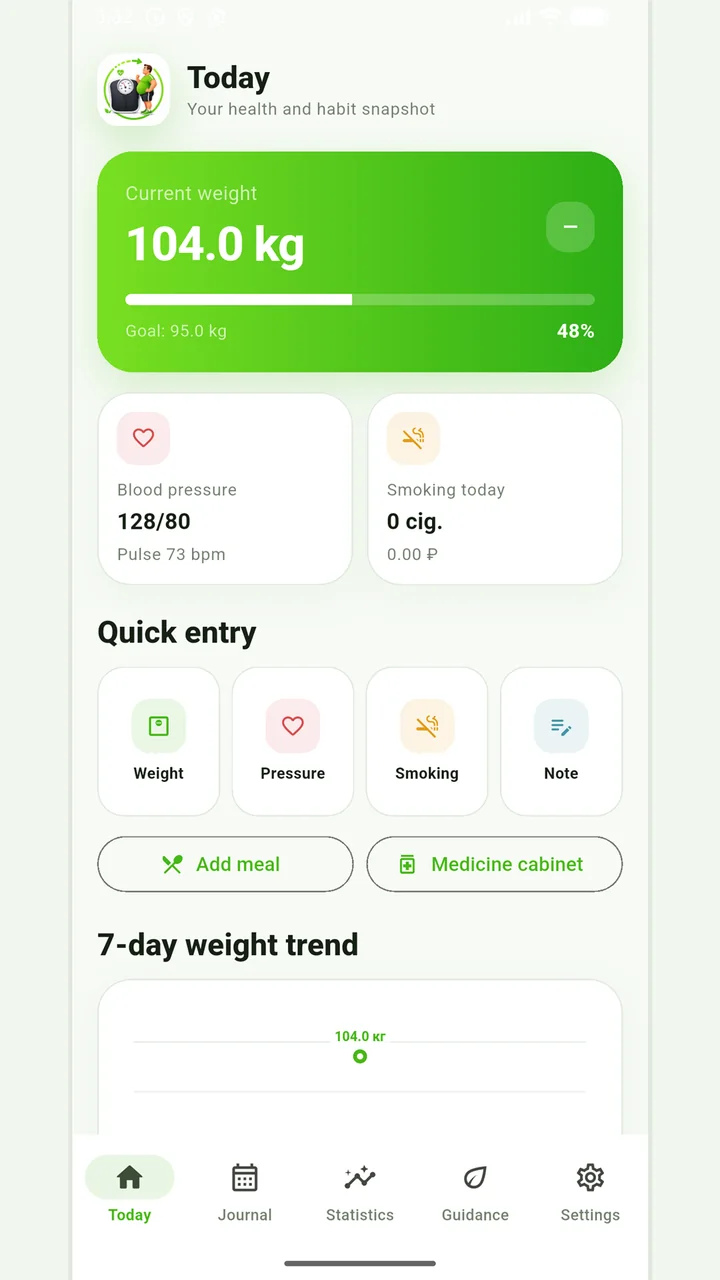
Vesometr 1.2.1
The main application tools and the current Android build.
How to use the collected data
Local recommendations are built according to specified rules and entered values, without artificial intelligence and remote analysis. These should be taken as journaling tips.
For a final review, go back to the last step: open specific dates via a calendar for context. Compare it to the original target and specifically note exceptions that cannot be explained by the available records.
The app organizes appointments and reminders, but does not verify treatment assignments and is not a substitute for professional advice.
Full medical disclaimerBrief conclusion
Different windows answer different questions: the short one shows details, the long one shows the general picture and changing modes. Working minimum to continue: open 7 days to check recent entries. After this, use the remaining points as a testable plan and keep only actual observations.