
Look at the average level, the frequency of peaks and the proportion of days with a decrease; A single difficult day does not determine direction.
Main idea
Decline or failure rarely follows a straight line. A neutral record of a breakdown is more useful than self-blame: it preserves context and helps you adjust the next step.
The graph is useful in distinguishing between filled zero days, gaps, and unusual events, rather than evaluating only the last point. First practical guide for this task: check the completeness of records for the selected period.
Action plan
- 01
Check the completeness of records for the selected period.
- 02
Celebrate weekends, trips, and stressful events.
- 03
Compare windows of the same length.
- 04
Formulate one next observable step.
What most often distorts observation?
- Treat the gap as zero.
- Try to achieve a perfectly straight line.
- Evaluate progress only in a continuous series.
How does this relate to Vesometr
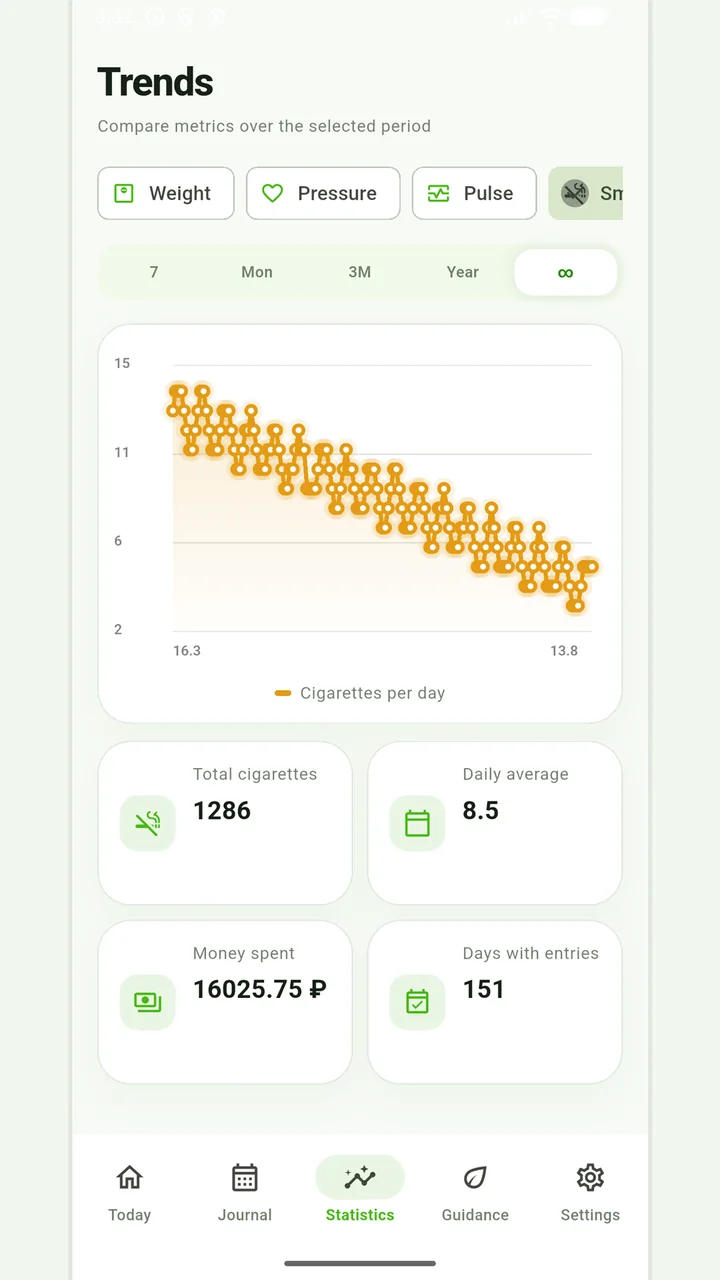
Vesometr statistics periods allow you to compare weekly, monthly and longer dynamics without recalculating old prices.
Habit journal
Quantity, historical pack price, expenses and trends across periods.
What to review later
The Habit Diary is valuable for its honesty, not its perfect line. The number, timing, and situation around an episode help you see recurring triggers and automatic scripts.
For a final review, go back to the last step: formulate one next observable step. Compare it to the original target and specifically note exceptions that cannot be explained by the available records.
The materials do not replace medical care for nicotine addiction. If changing a habit on your own is difficult, discuss evidence-based support with a specialist.
Full medical disclaimerBrief conclusion
The graph is useful in distinguishing between filled zero days, gaps, and unusual events, rather than evaluating only the last point. Working minimum to continue: check the completeness of records for the selected period. After this, use the remaining points as a testable plan and keep only actual observations.