
First look at the overall slope over several weeks, then check individual points using your calendar and notes.
What matters
One number on the scale says almost nothing about the direction of change. It is more useful to have the same measurement conditions, understandable frequency of recordings and monitoring the line over several days or weeks.
A graph helps you see direction only when you take into account the period scale, omissions, and differences in measurement conditions. First practical guide for this task: open a period sufficient for your task, not just the last two days.
How to organize observation
- 01
Open a period sufficient for your task, not just the last two days.
- 02
Note how many dimensions actually lie behind the line.
- 03
Find outliers and check conditions on the corresponding date.
- 04
Formulate a neutral conclusion: direction, stability and what cannot yet be stated.
What most often distorts observation?
- Consider the connected line as a continuous measurement between sparse points.
- Drawing conclusions based on a graph scale that is too narrow.
- Ignore omissions and changes in measurement mode.
How does this relate to Vesometr
In Vesometr statistics, you can switch 7 days, month, 3 months, year and the entire period, so as not to take the window scale for the result itself.
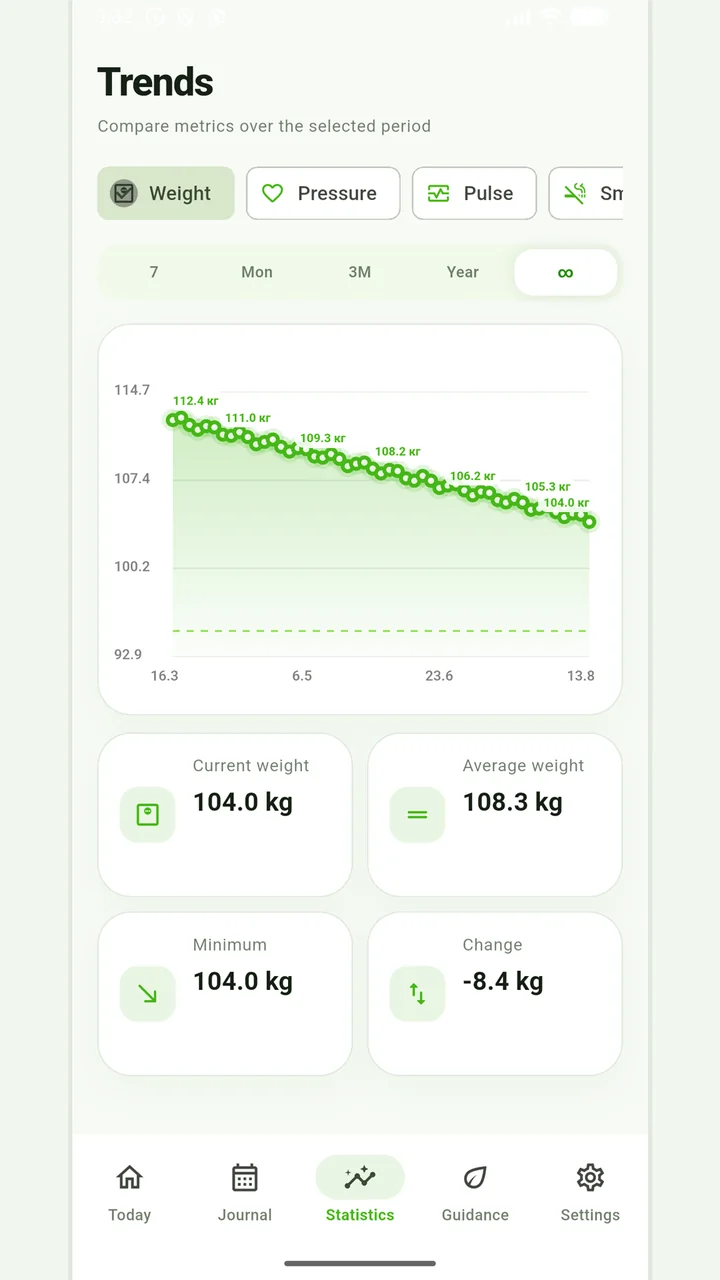
Weight trends
Charts, a target and period comparisons without judging progress by one number.
A conclusion without rushing
Body weight changes not only because of adipose tissue: the reading is influenced by water, the contents of the digestive system, salt, time of day and physical activity. Therefore, the diary is needed for context, not for assessing each individual number.
For a final review, go back to the last step: formulate a neutral conclusion: direction, stability and what cannot yet be stated. Compare it to the original target and specifically note exceptions that cannot be explained by the available records.
Don't use weight changes as the only way to assess your health. Unexplained rapid weight changes, severe swelling, weakness or other worrying symptoms should be discussed with your doctor.
Full medical disclaimerBrief conclusion
A graph helps you see direction only when you take into account the period scale, omissions, and differences in measurement conditions. Working minimum to continue: open a period sufficient for your task, not just the last two days. After this, use the remaining points as a testable plan and keep only actual observations.