
Select several indicators, important events of the year and an up-to-date list of medications, leaving the primary data available for clarification.
What matters
The PDF log is a copy of user records, not a medical record or report. Its task is to support the conversation and more accurately describe the observed dynamics.
An annual review is useful as a quick map of changes, but the clinician does not need a complete daily archive without designated periods and questions. First practical guide for this task: open the yearly chart and mark the noticeable periods.
How to organize observation
- 01
Open the yearly chart and mark the noticeable periods.
- 02
Make a list of new symptoms and diagnoses from medical records only.
- 03
Update your medications and habits.
- 04
Generate a short PDF for the relevant window.
What most often distorts observation?
- Make your own diagnosis on an annual schedule.
- Print the entire archive without a resume.
- Replace preventative check-ups with an app.
How does this relate to Vesometr
Vesometr's annual scale helps you find dates for a more focused and readable report.
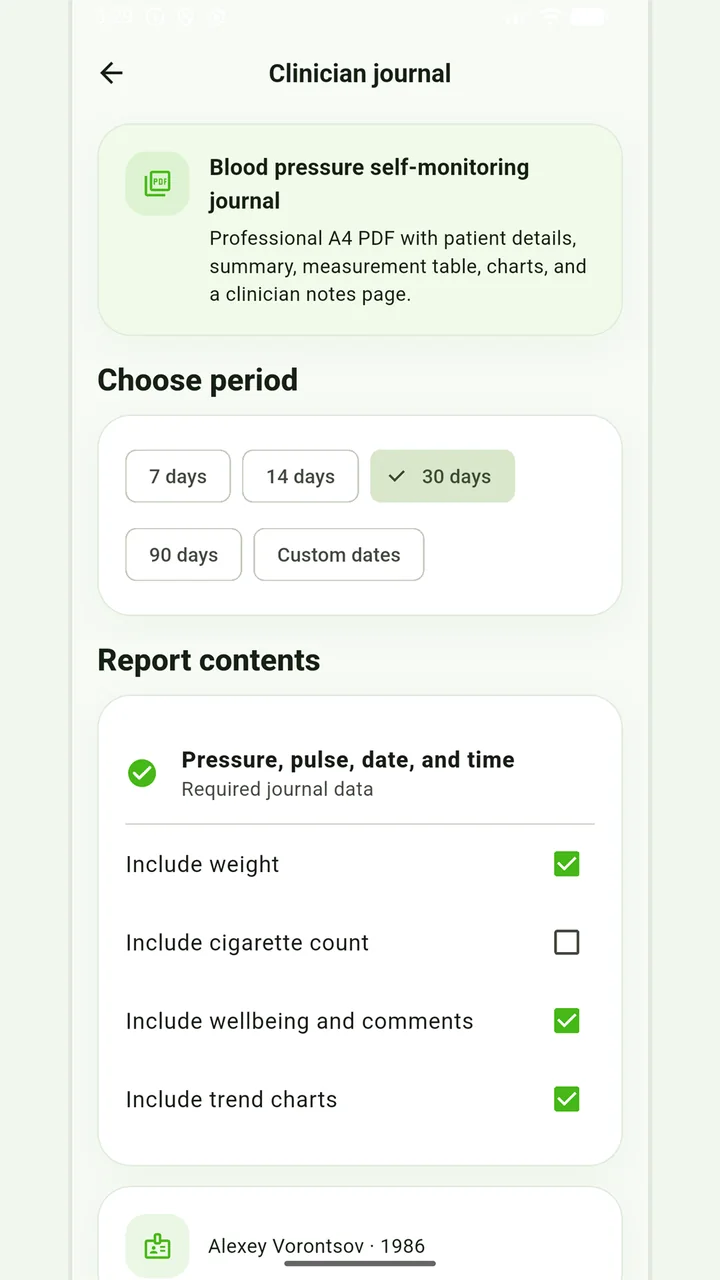
PDF for a consultation
Choose the period and journal sections before sharing a report with a professional.
A conclusion without rushing
A good report saves time on reconstructing the chronology. Dates, measurements, medications, and notes are visible, but only the user and physician determine what is clinically important.
For a final review, go back to the last step: generate a short pdf for the relevant window. Compare it to the original target and specifically note exceptions that cannot be explained by the available records.
Don’t put off applying in order to accumulate the perfect report. If it is an emergency, report symptoms and follow directions from your healthcare provider; the diary can be shown later.
Full medical disclaimerBrief conclusion
An annual review is useful as a quick map of changes, but the clinician does not need a complete daily archive without designated periods and questions. Working minimum to continue: open the yearly chart and mark the noticeable periods. After this, use the remaining points as a testable plan and keep only actual observations.